Employee Turnover Diagnostics
Project Overview
Organizations often track turnover as a simple metric, but this project went deeper to identify the specific ‘operational burden’ of attrition. Using a dataset of 687 employee separations (2023–2025), I moved beyond high-level percentages to diagnose exactly who was leaving, where the costs were concentrated, and why the organization was losing both new hires and veterans.
The Challenge: A significant limitation of this project was the absence of comprehensive data on the total active headcount, which prevented the calculation of standard turnover rates as a percentage.
Strategic Pivot: Instead of calculating rates, I focused the analysis on Absolute Volume and Operational Burden. I identified ‘Hotspots’ based on where the highest number of backfills and training hours were being consumed, treating high-volume areas as critical cost centers regardless of their headcount size.
Data Preparation
To ensure accuracy and improve the quality of insights, I completed a structured data cleaning and preparation process that included:
Standardizing inconsistent labels
Correcting variations in cities, regions, and job roles to ensure all records aligned under a single naming convention.
Creating tenure groups using bin dates
I restructured tenure bins to isolate early exits (<6 months) from long-term exits (>3 years), revealing a ‘U-Shaped’ risk pattern that was previously hidden by broad averaging.
Categorizing dismissal reasons
Grouped dozens of termination descriptions into three clear categories: involuntary, voluntary, and other.
This allowed for cleaner segmentation and helped isolate operational turnover pattern.
Age Calculation
Calculated employee age using date of termination minus date of birth to enable demographic cohort analysis.
rns.
Analytical Approach
I applied a multi-layer analysis to break down dismissals by:
• Region
• Business role
• Dismissal type
• Function clusters (manufacturing, supply chain, business support)
• City-level turnover
• Individual managers
• Tenure
Layering these views allowed me to move from broad organizational patterns to detailed insights that pinpointed operational pressure points.
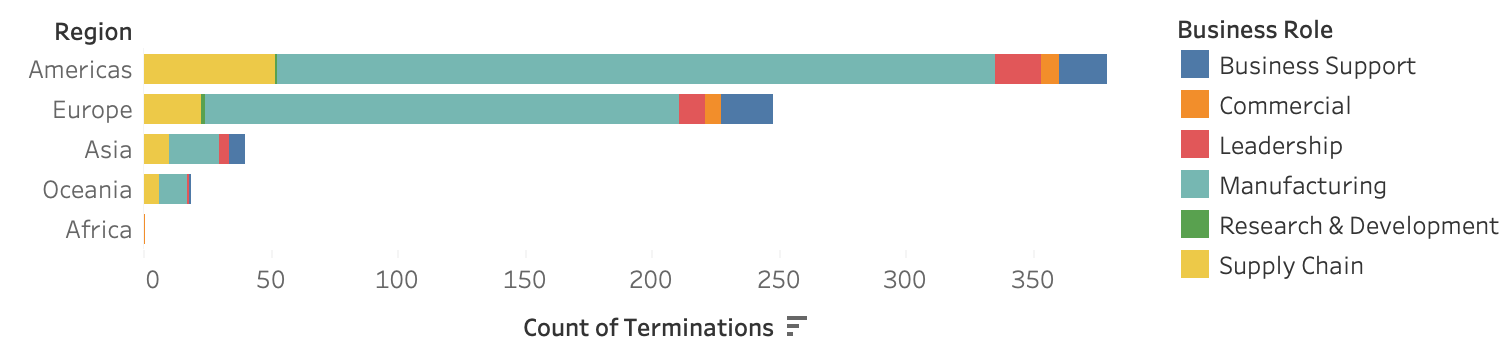
At the global level, turnover patterns vary drastically, with the Americas showing the largest volume of dismissals followed by Europe. With a large quantity of turnover in the manufacturing sector.
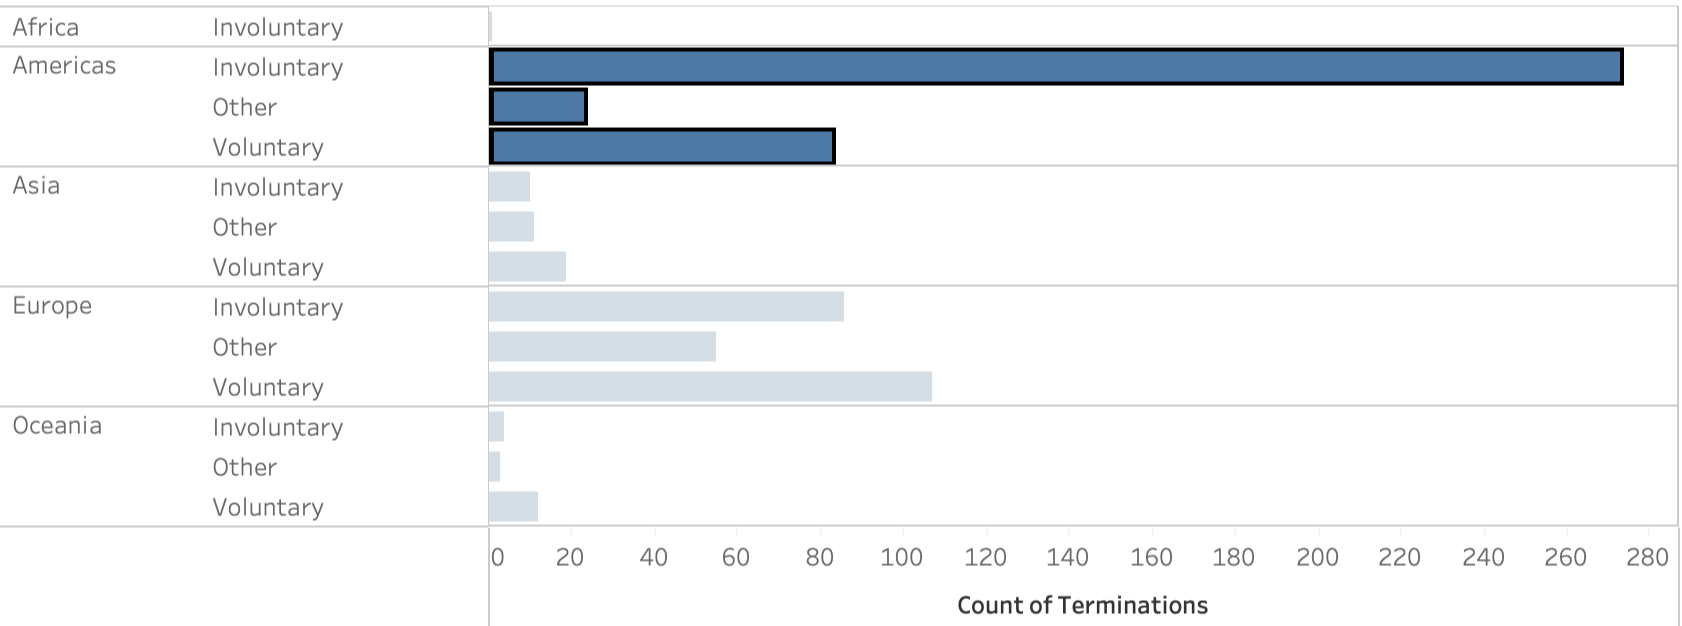
The Americas demonstrated the highest volume of involuntary dismissals, while the other regions experience predominantly voluntary turnover. This fundamental difference in separation types points to distinct underlying causes that require region-specific interventions.
Key Insight:
The Americas’ primary turnover is from involuntary separations.
Outside the Americas, voluntary turnover was the primary driver.
This regional variation provides critical context before drilling deeper into specific hotspots. The concentration of involuntary separations in the Americas warranted immediate deeper investigation to understand the root causes.
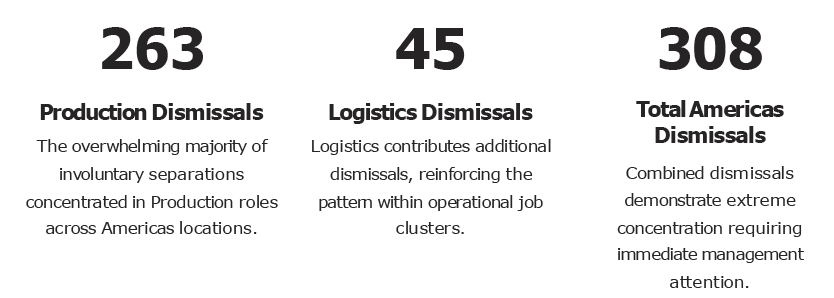
When isolating the Americas region, the turnover patterns became dramatically clearer. Production and Logistics account for almost all involuntary dismissals, with no other job cluster coming close to this concentration. Indicating the issue was not broadly organizational, but highly concentrated in specific functional areas.
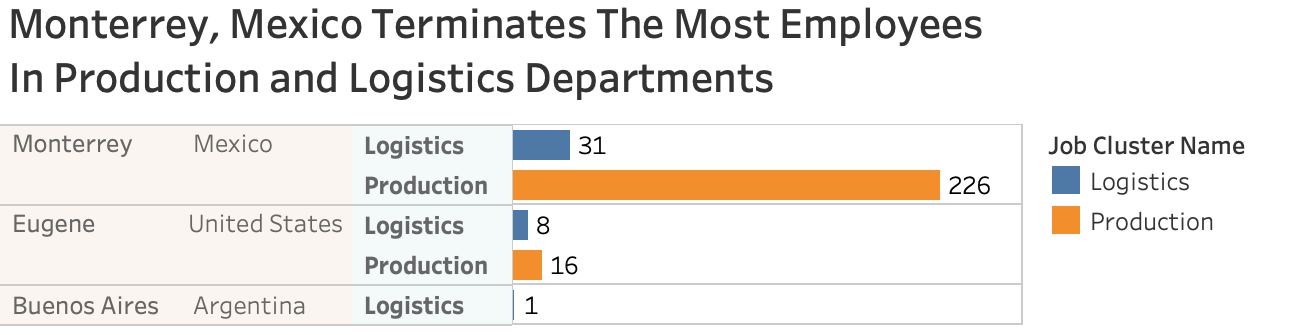
Critical Geographic Hotspot: Monterrey Analysis
When drilling down into Production and Logistics for the Americas, Monterrey emerged immediately as the primary hotspot. Turnover in this single city outweighs many entire regions combined, indicating that the problem is not broadly regional, it is highly localized to specific operational sites.
This geographic concentration transforms the challenge from a broad organizational issue into a focused, addressable problem with clear boundaries and specific stakeholders.
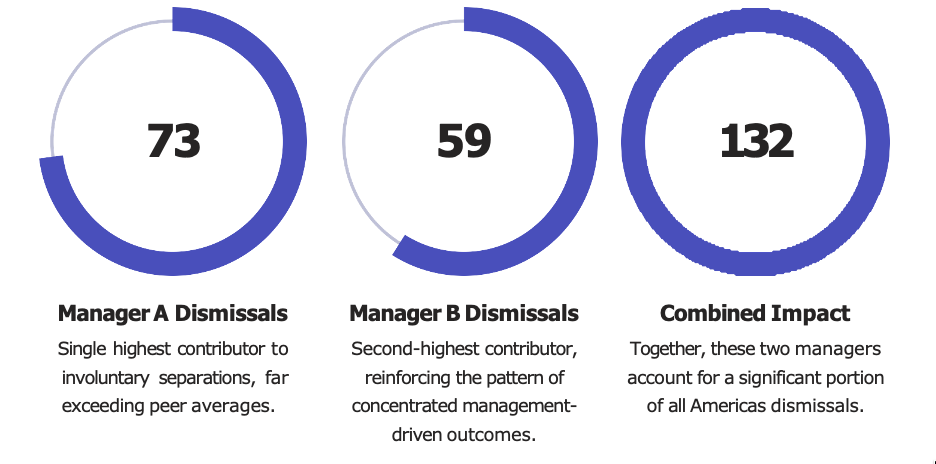
Manager-Level Analysis: Leadership Patterns Emerge
To understand what was driving the exceptionally high dismissals in Monterrey’s Production and Logistics functions, I analyzed turnover by individual manager. This granular view revealed the sharpest insight of the entire analysis: two managers alone accounted for a disproportionate portion of involuntary terminations.
Demographics & Tenure Risk Analysis
While specific managers drove localized turnover, a broader analysis of the employee lifecycle revealed systemic retention failures affecting two distinct populations. I visualized the data by Age and Tenure to pinpoint exactly when the organization was losing talent.
Mid-Career Crisis

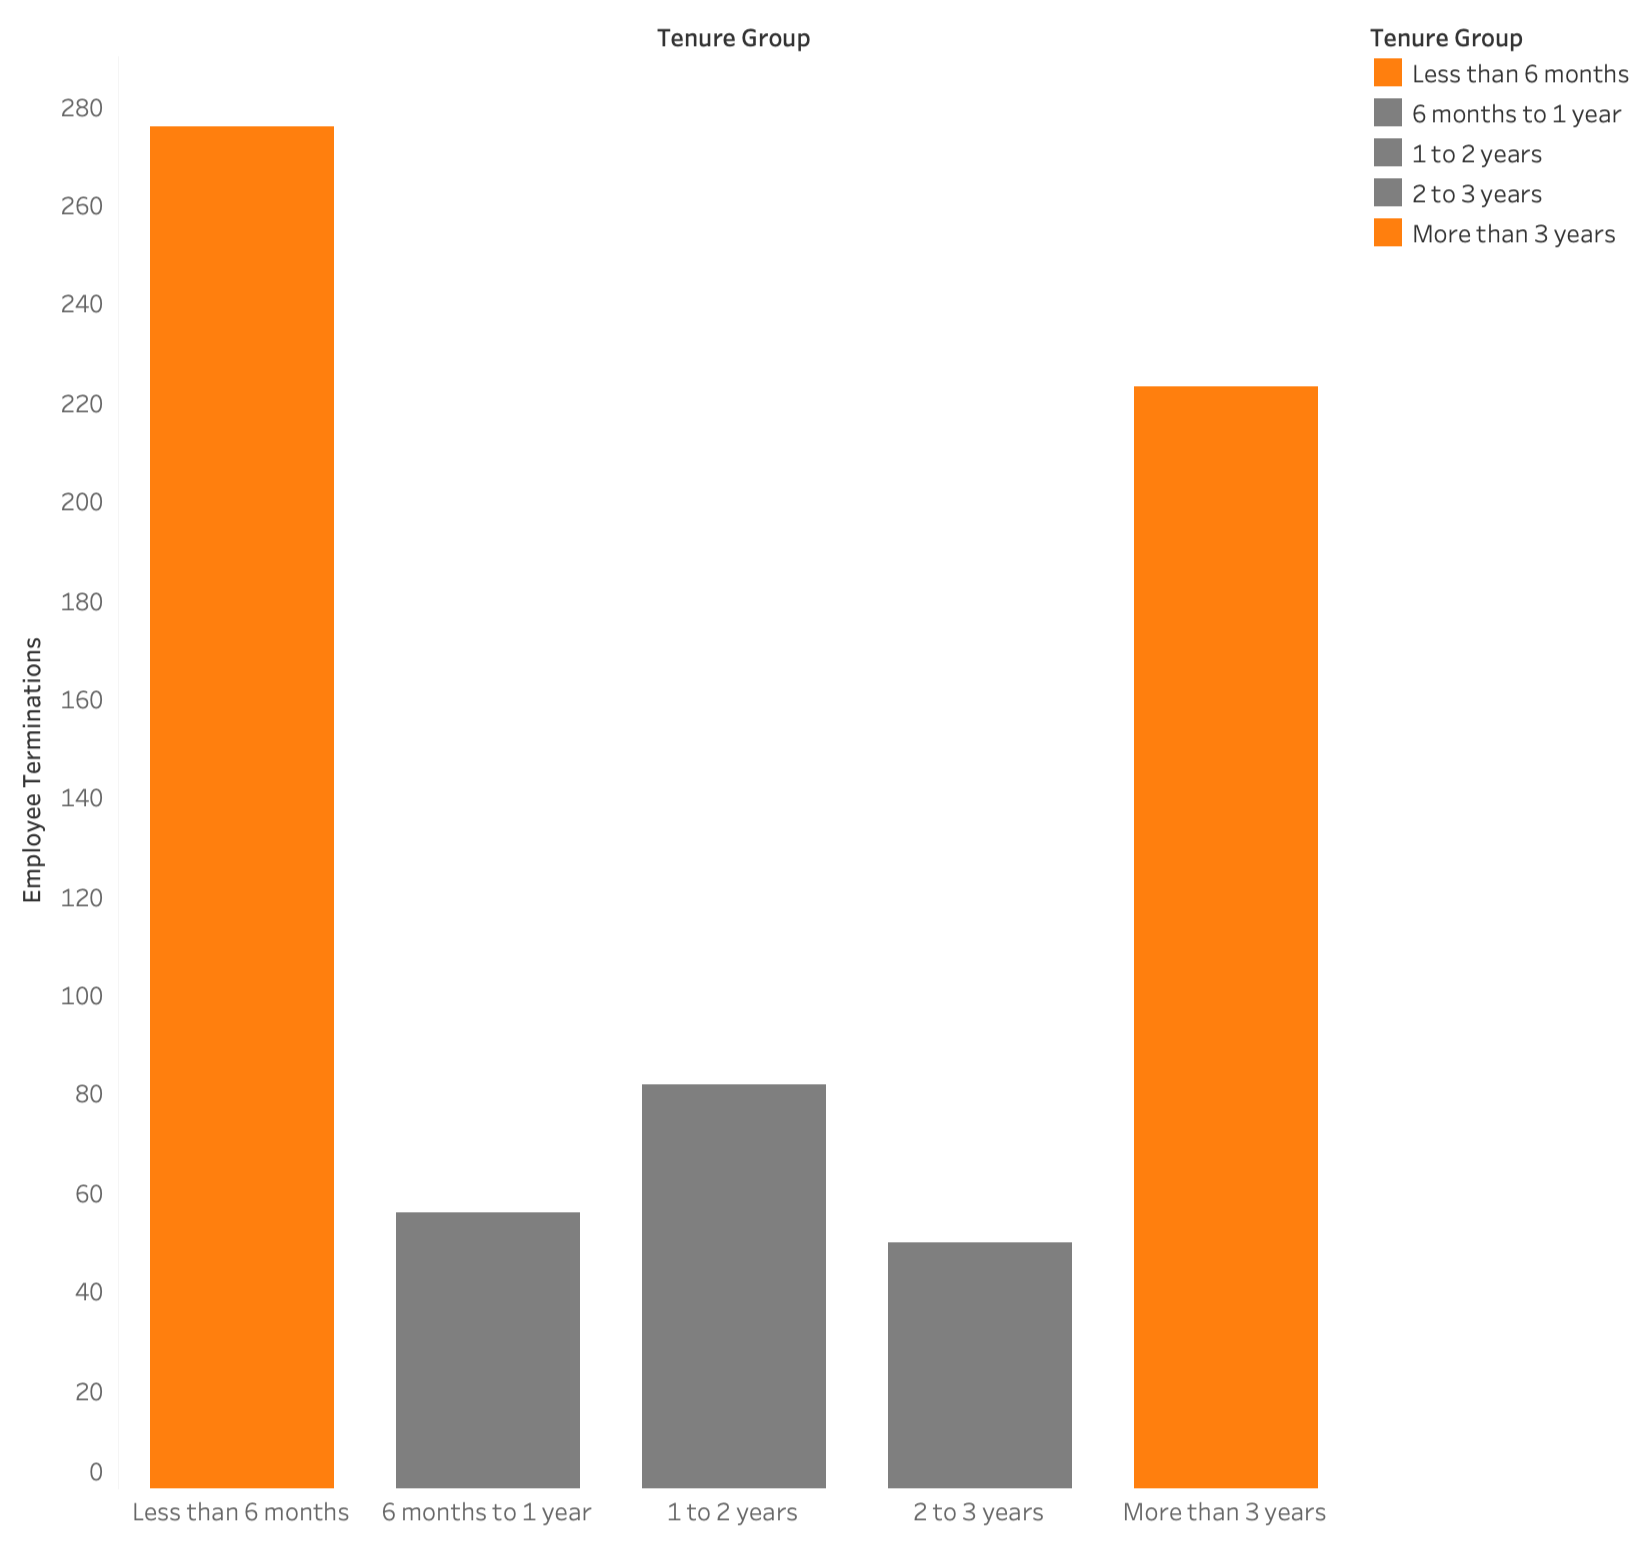
The Tenure “U-Curve”
Mid-Career Crisis: The Career Stage chart (Top) challenges the assumption that turnover is purely an entry-level issue. The 30–44 age demographic represents the highest volume of separations (~272 exits), signaling a massive loss of fully productive, institutional knowledge.
The ‘U-Curve’ Risk: The Tenure Group chart (Bottom) reveals a distinct ‘U-shaped’ risk profile. The organization faces high early exits with 40% of exits occurring in the first 6 months, followed by a period of stability, and then a resurgence of turnover after the 3-year mark. This indicates that while onboarding fails new hires, career stagnation is driving away veterans.
Key Findings
1. The Americas had the highest concentration of involuntary dismissals
This region accounted for 55% of all dismissals, significantly more than other regions.
2. Production and Logistics carried most of the turnover load
These two functions consistently showed the highest dismissal counts across all regions.
3. Monterrey was the leading city for involuntary dismissals
Turnover was especially high in logistics and production roles.
4. Two Monterrey managers handled a disproportionate number of terminations
This concentration indicates possible workload strain, coaching inconsistencies, or limited manager support.
5. Turnover followed a ‘U-curve’ pattern in tenure
Separations spiked within the first 6 months and surged again after 3 years, leaving the 1-3 year period relatively stable.
Interpretation
The data shows that turnover issues are not evenly distributed, but instead cluster around specific functions, locations, and managers. Production and Logistics roles are especially vulnerable, which often reflects challenges in training, role clarity, or workload issues. The concentration of dismissals under two managers highlights a need to examine leadership processes and support in critical sites. Additionally, the concentration of exits under 6 months indicates onboarding gaps, while the surge in veteran turnover (>3 years) signals a lack of career progression for experienced staff.
Overall, the patterns indicate deeper structural and managerial issues rather than isolated performance problems. Strengthening expectations, processes, and early support will help reduce avoidable turnover and stabilize staffing in key operational areas.
Recommendations
1. Strengthen onboarding for Production and Logistics roles
Standardize training, add hands-on learning, and implement 30-60-90 day check-ins to reduce early performance issues.
2. Support high-turnover managers in Monterrey
Review manager workload, provide coaching resources, and ensure expectations are consistent across teams.
3. Align performance processes across similar teams
Create shared scorecards, standardize escalation steps, and ensure clear criteria for success in operational roles.
4. Improve hiring accuracy for frontline roles
Refine screening to match role demands, add realistic job previews, and prioritize traits linked to early success.
5. Build a monthly turnover monitoring dashboard
Track turnover by region, function, manager, and tenure with KPIs that flag areas needing attention.
6. Increase HR and operations collaboration
Hold regular syncs to review training, onboarding outcomes, and workforce stability in high-impact areas.
7. Assess site-level conditions in high turnover locations
Use anonymous surveys, safety reviews, and listening sessions to identify local factors affecting retention.