Property Value Analysis: Airport Proximity
Project Overview
This project analyzed Zillow-estimated home values near two California municipal airports (Watsonville and Salinas). The goal was to determine whether proximity to an airport negatively impacts property prices and to identify which factors, such as square footage or year built, are the actual drivers of valuation. The dataset covered over 2,000 homes across both regions.
Data Preparation
To ensure accurate valuation modeling, I completed a structured data cleaning process that included:
Standardization: Standardized column naming conventions across datasets for consistency and clarity to align Watsonville and Salinas data.
Duplicate Detection: Performed a comprehensive review of the combined dataset and confirmed zero duplicate records were present.
Value Corrections: Fixed formatting errors, such as year-built values with decimal points, and standardized all monetary values to two decimal places.
Outlier Analysis: Applied Interquartile Range (IQR) whisker analysis to identify and remove significant price outliers, ensuring the model wasn't skewed by anomalies.
Analytical Approach
I applied a multi-factor analysis to break down property value drivers by:
Region (Watsonville vs. Salinas)
Driving Distance to Airport
Square Footage (Interior living space)
Year Built (Construction vintage)
Community Amenities (Schools, parks, golf courses)
Price per Square Foot
Layering these views allowed me to challenge the assumption that airport noise lowers value and pinpoint the true predictors of market pricing.
Key Findings
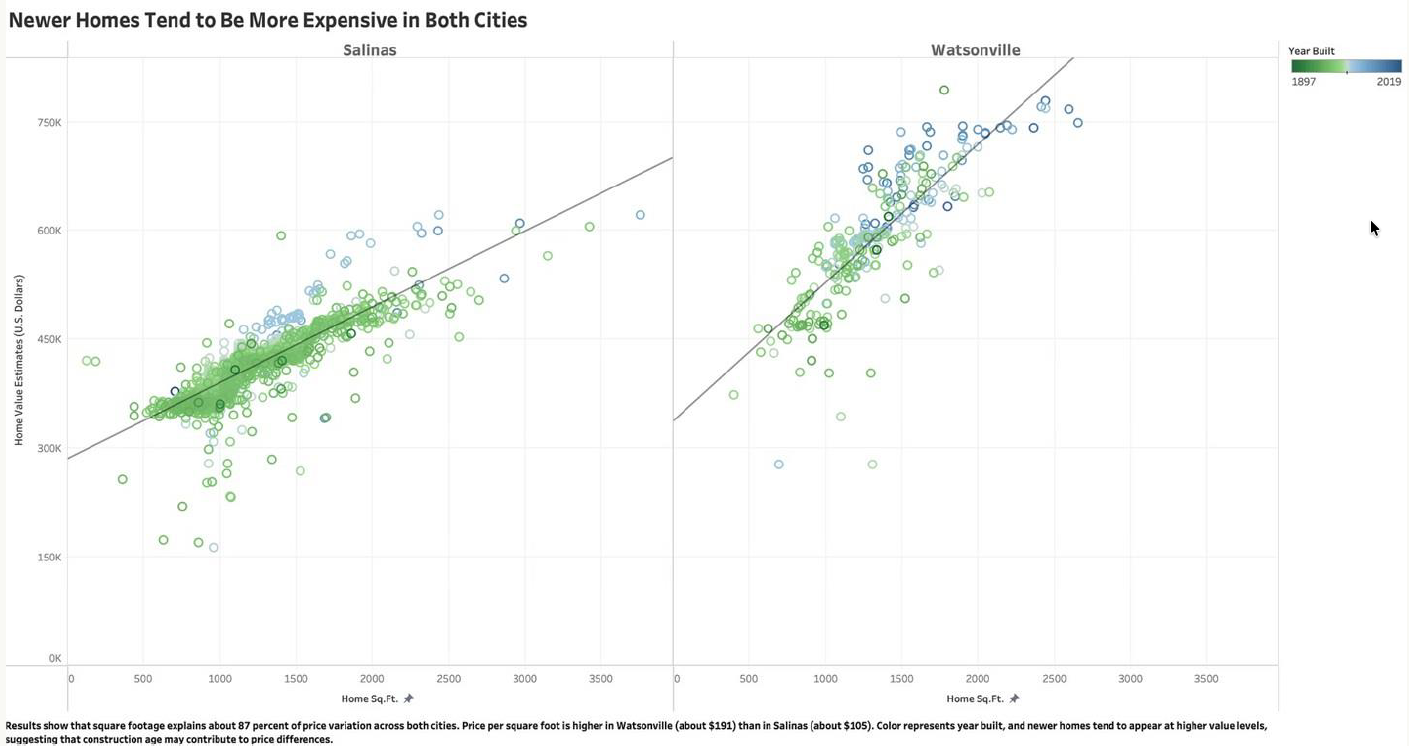
Newer homes command a premium, but age is secondary. While newer homes tend to be more expensive due to modern standards and energy efficiency, ‘Year Built’ remains a secondary factor compared to total square footage
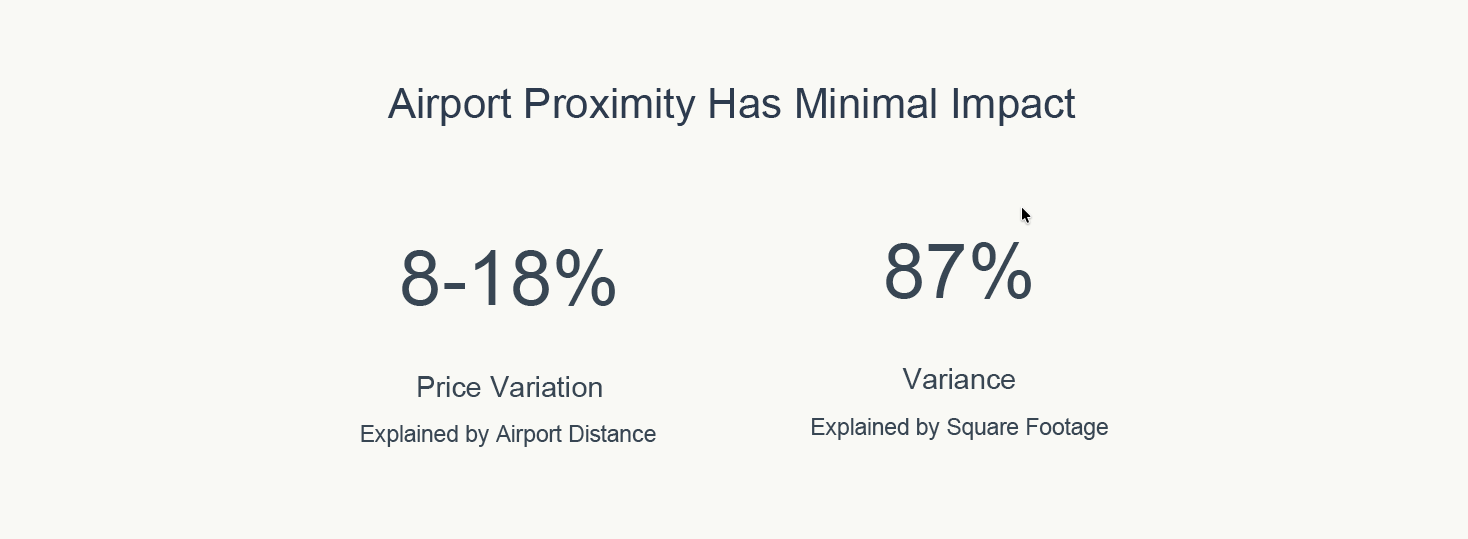
Airport proximity has minimal impact on value. Driving distance from the airport does not meaningfully affect home values. Distance explained only 8% of price variation in Salinas, and 18% in Watsonville.
Square Footage Dominance
To understand what was driving valuations in the absence of a clear ‘airport penalty,’ I analyzed price correlations. This granular view revealed that physical size, not location relative to the airport, was the overwhelming determinant of value.
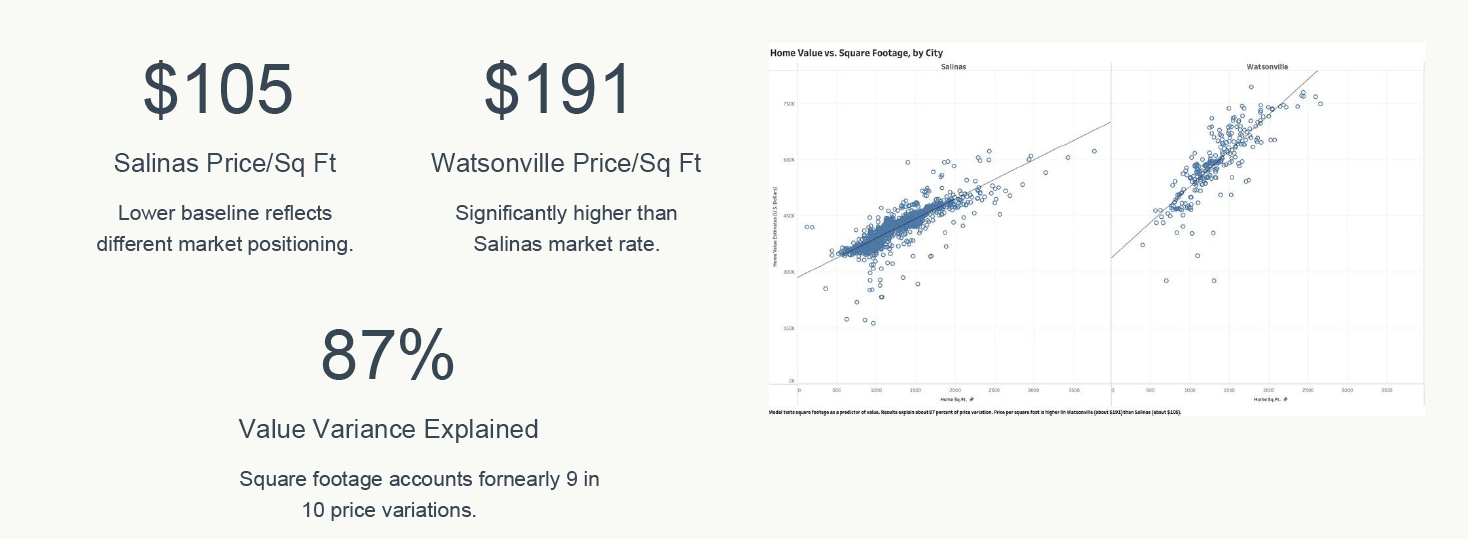
87% of variance is explained by square footage alone. Accounting for nearly 9 in 10 price variations across both cities, making it the strongest single predictor.
$191 Price/Sq Ft in Watsonville. Homes command a significantly higher price per square foot compared to the larger Salinas market.
$105 Price/Sq Ft Salinas. Shows a lower baseline price per square foot, reflecting different market positioning despite similar distance metrics.
Straight-Line Radius & Amenity Clustering
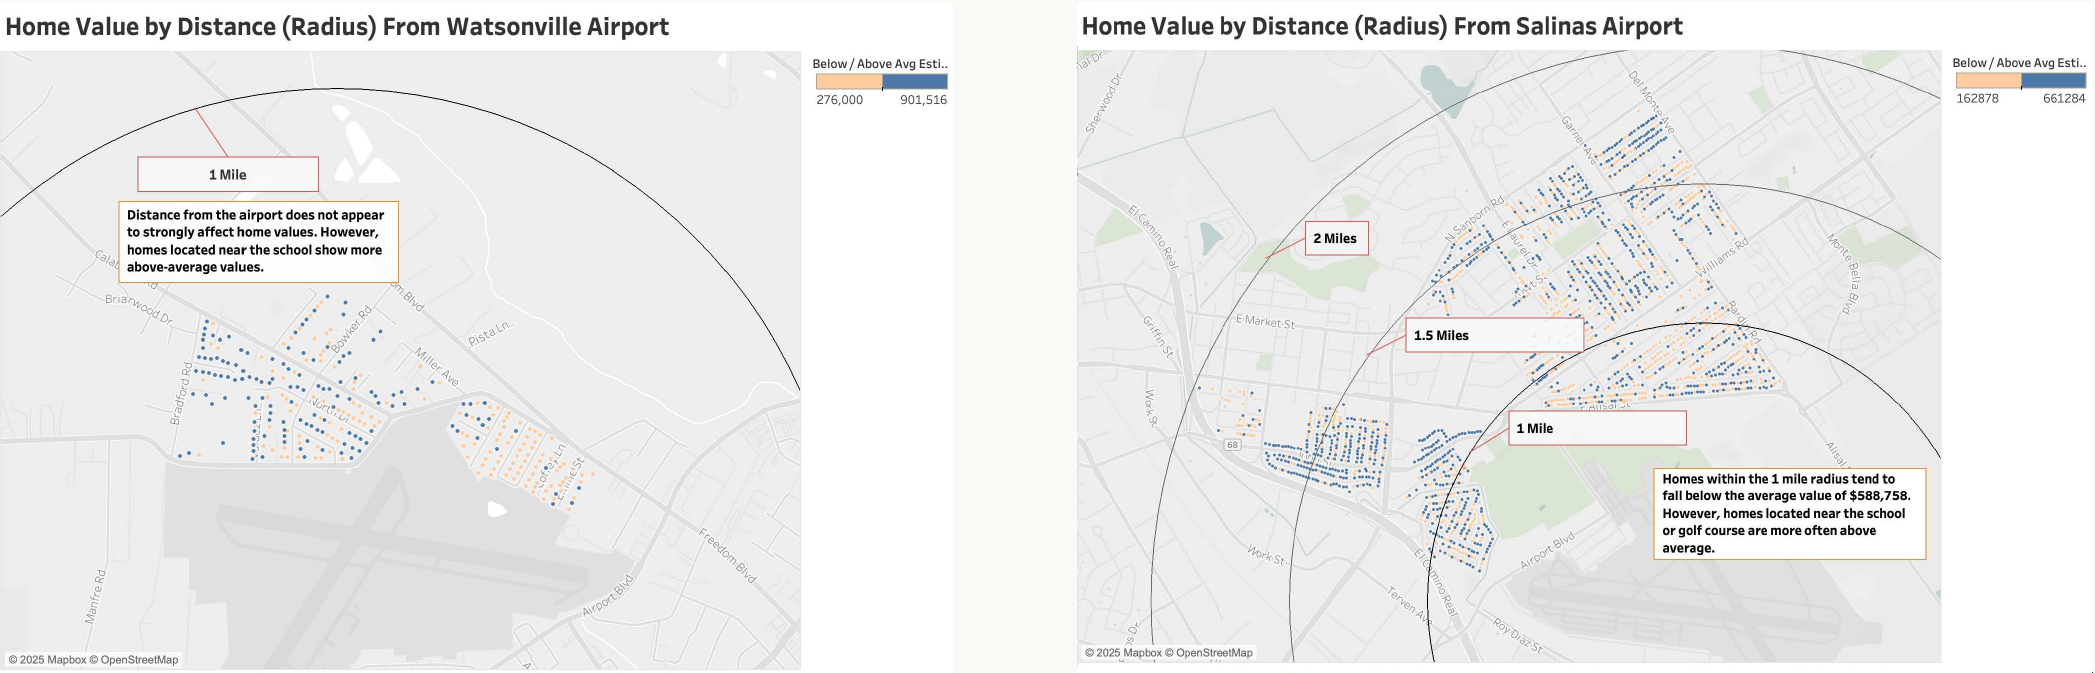
Initially, I analyzed driving distance, which showed minimal correlation to price. To verify this, I pivoted to a straight-line radius analysis to test for immediate geographic proximity.
The Result: The radius view confirmed that being closer to the airport did not negatively impact value.
The Discovery: This spatial view revealed that value hotspots were not determined by distance from the airport, but by proximity to amenities. Higher valuations consistently clustered near schools, parks, and golf courses. For example, homes near the school in Watsonville consistently trended above average, while Salinas homes near the golf course showed similar premiums.
New Homes Command Premium
While newer homes tend to be more expensive due to modern standards and energy efficiency, "Year Built" remains a secondary factor compared to total square footage.
Interpretation & Recommendations
The data challenges the common assumption that airport proximity acts as a ‘nuisance factor’ that depresses property values. Instead, values are driven by standard market fundamentals: size and neighborhood amenities. The straight-line radius analysis revealed that homes within 1 mile of Salinas airport actually averaged below the city mean, but this was due to neighborhood characteristics rather than noise, as values spiked near schools regardless of airport distance.
Overall, the patterns indicate that buyers prioritize tangible living space and community features (like school districts and golf courses) over noise avoidance.
Recommendations
Prioritize Amenities in Development: Future development and zoning decisions should emphasize proximity to schools and parks to maximize property values, as these are the primary location magnets.
Re-evaluate Noise Mitigation Impact Policy: Decisions regarding land use near airports need not strictly prioritize noise-mitigation premiums, as the market does not heavily penalize proximity.
Market Positioning Strategy: For valuation assessments, square footage should be weighed approximately 5x higher than age or location factors, given the 87% correlation with price.